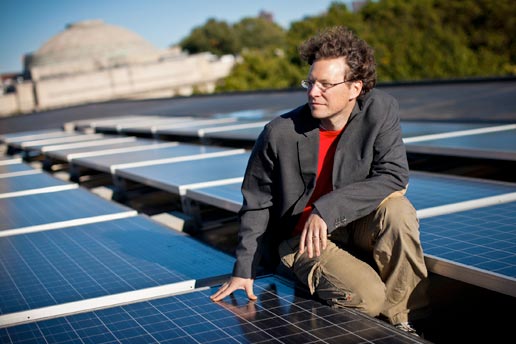
Overview
A modeling tool from MIT’s Sustainable Design Lab is now helping to support the sustainable growth of the world’s rapidly expanding urban areas. Rather than planning one green building at a time, urban designers and architects can draw a new neighborhood or city and then use the tool to calculate energy use and emissions for the entire collection of buildings in their design. They can also determine how comfortable the residents will be—both indoors and outdoors—and how likely they will be to walk rather than drive. In earlier work, the MIT researchers developed a “solar map” of Cambridge, Massachusetts, that enables residents to find out the optimal solar photovoltaic (PV) installation for a particular rooftop, how much it would cost, and how soon the investment would pay off.
One way to reduce global carbon emissions is to make urban neighborhoods more resource efficient. Buildings are responsible for high levels of energy use and carbon emissions—a fact that has inspired the development of simulation tools that can predict the future energy use of individual buildings with remarkable accuracy. But those tools can’t effectively model groups of dozens or hundreds of buildings. The problem? In dense urban settings, buildings interact strongly with each other and with objects such as trees and hills. The results—shaded areas, urban heat islands, localized wind patterns, and so on—can significantly alter the energy use and associated carbon emissions of each building.
“Modeling the sustainability of cities has been a huge challenge for researchers,” says Christoph F. Reinhart, associate professor of architecture and director of the Sustainable Design Lab in MIT’s Building Technology Program (BTP). “But with the rise of geographic information systems [GIS], we suddenly have these immense public databases that give us enormous amounts of information about buildings.” By combining such data with well-developed modeling tools for single buildings, he and a group of PhD candidates in the BTP have been developing tools that will help ensure the growth of cities that are not only resource-efficient and environmentally friendly but also attractive to residents.
Mapping a city’s solar potential
As a first test of their modeling approach, the researchers developed a solar map that analyzes the potential for installing PV systems on rooftops in Cambridge, Massachusetts. Working with the City of Cambridge, Reinhart and graduate student J. Alstan Jakubiec first generated a detailed topographical model of Cambridge based on publicly available GIS data, including each building’s type, footprint, exterior materials, year of construction, and more. They also drew on data from a publicly funded LiDAR survey. (LiDAR— Light Detection And Ranging—is a remote sensing technique in which instruments on aircraft use laser beams to measure the distance to objects on the ground.) Those measurements provided critical information such as the shapes of individual roofs (angled roofs can have shady sections not suitable for PVs) and the presence of nearby buildings, trees, and hills that may block or reflect the sunlight.
Drawing on historical weather data, the researchers determined hourly temperature measurements and sky conditions (overcast or sunny) over Cambridge for a typical year. Based on the roofing materials on individual buildings, they estimated how hot the roofs would get—a key factor in getting an accurate outcome because hotter PV systems are less efficient. They then analyzed annual solar radiation on the surfaces in their 3-dimensional model of Cambridge using DAYSIM, daylighting analysis software that was developed by Reinhart and is now used worldwide. Based on those results, they generated an online map of 17,000 rooftops, each consisting of smaller sections of various colors indicating which parts have excellent, good, poor, and no solar potential. A Boston-based collaborator—Eduardo Berlin from Modern Development Studio LLC—then designed an online viewer as well as a financial analysis module for PV installations.
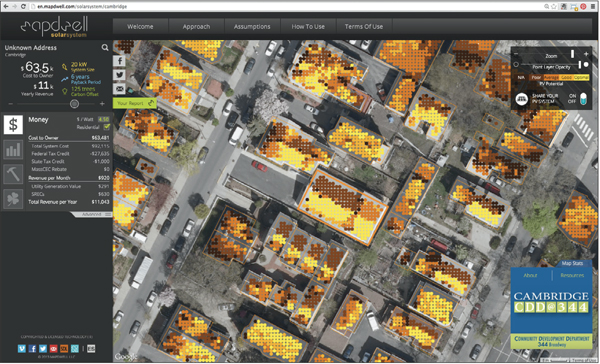
This screenshot shows sample results from an analysis using the solar map of Cambridge, Massachusetts. The colored dots indicate the solar potential of specific areas of each rooftop. The panel at the left shows the optimal size for a solar installation at a specific (unidentified) address as well as its cost, payback time, and additional financial information. Other display options provide technical and environmental details. The online system was developed by Mapdwell, an MIT spin-off company that has licensed the technology and is now working with other cities and regions worldwide to implement solar maps for their urban areas.
Using the online solar map residents and other users can type in a street address, find out how many square feet of the roof are optimal for solar panels, calculate the actual cost of installation (including federal and state tax credits), determine annual savings and payback time, and find out the annual reduction in carbon emissions that would result.
Urban sustainability—a broader view
But Reinhart notes that “just putting a bit of PV on some roofs” doesn’t make a city sustainable. To be truly sustainable, a city must have low energy use and low carbon emissions, and it must be a place where people want to live. Reinhart and his collaborators therefore formulated “umi,” a modeling tool that addresses multiple aspects of sustainability using simulation software that architects and urban planners will find familiar and easy to use. Using a popular computer-aided-design modeling platform called Rhinoceros, users of umi first create a basic 3-dimensional model of their existing or proposed neighborhood or city. They then use familiar simulation programs that run on top of the Rhino software to analyze how the defined urban setting performs on four key metrics: energy consumption, transportation, indoor daylighting, and outdoor comfort.
Case study: Boston
To test umi’s capabilities, Reinhart’s team performed a case study of a hypothetical mixed-use development in Boston, Massachusetts. To begin, they selected Boston as their location, thereby defining hourly radiation data, temperature, relative humidity, and other key parameters. They then built a model of their neighborhood (see image below) consisting of buildings, trees, and other shading objects along with parks, courtyards, and walking paths. To classify each building, they chose from a series of “templates” that specify age, style, materials, use, and so on. They then used the simulation programs to examine the sustainability of their neighborhood.
Model of a mixed-use development in Boston
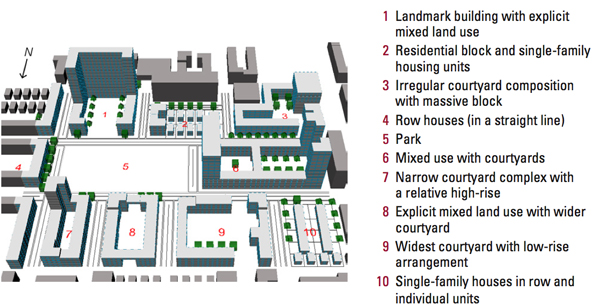
Using umi, the researchers performed a case study of this hypothetical neighborhood in Boston, Massachusetts. They defined the layout of buildings, parks, courtyards, trees, and other objects in their neighborhood and classified each building using templates to specify its age, style, materials, use, and so on. They then used umi’s simulation tools to analyze a series of metrics indicating the sustainability of their design.
Energy. For its energy “module,” umi uses a popular simulation tool called EnergyPlus to calculate the energy use of individual buildings while taking into account the impacts of neighboring objects such as other buildings and trees. Performing that analysis for their Boston development, Reinhart and Jakubiec generated the first figure shown below. Colors in the second figure show the level of energy use intensity converted to kilowatt-hours per square meter per year. Aggregating their hourly building-by-building results, they generated the curves in this diagram, which show total use of electricity (blue) and natural gas (red) and associated carbon emissions (green) per day between January 1 and December 31.
Energy analysis of the mixed-use development
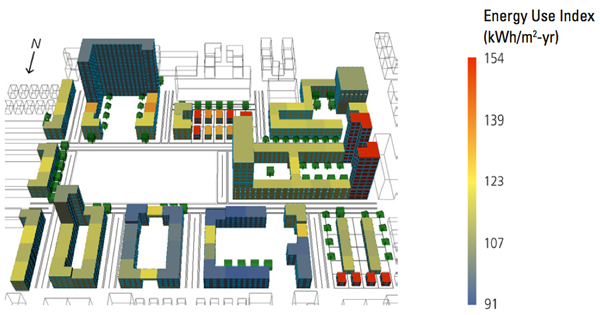
This diagram shows the results of analyzing the model neighborhood with umi’s energy module, which calculates the energy use of individual buildings taking into account shading and other impacts of nearby buildings, trees, and other objects. Buildings with high energy intensity are readily evident by their red coloring.
Total energy use and carbon emissions of the development
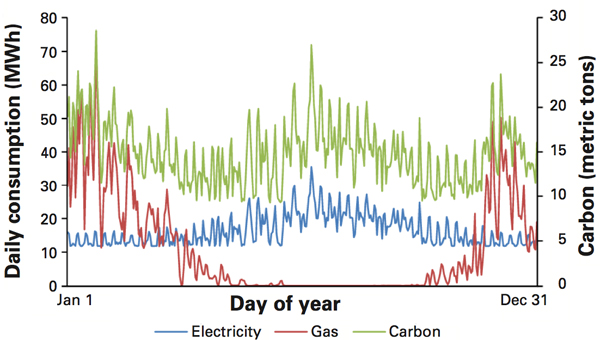
Using umi, the researchers performed a case study of the hypothetical neighborhood in Boston. These curves show total hourly use of electricity and natural gas and associated carbon emissions for the neighborhood over a full year. A notable feature is the high summertime peak in electricity consumption and carbon emissions. One approach to reducing those peaks would be to target the high-energy-intensity buildings in the figure above. But in a dense urban area, planners can consider other approaches, for example, reorienting certain buildings, altering the distances between them, or changing the number of commercial versus residential buildings because they’re used at different times. Using umi, planners can try out different options to find the one that’s most energy efficient for the whole neighborhood.
Mobility. Since transportation also contributes to carbon emissions, another module—designed by Reinhart and graduate student Tarek Rakha— examines whether residents must drive or can walk to schools, shops, restaurants, and other amenities. The module draws on Walkscore, a popular online tool for measuring how walking-friendly an area is based on proximity to amenities as well the presence of sidewalks, the length of blocks, and other factors. In addition, umi combines the Walkscore results with its data on urban terrain and outdoor comfort to estimate the number of trips throughout a year that will actually be made on foot. In initial analyses, the Boston development proved largely “very walkable” with several sections designated as “a walker’s paradise.”
Indoor daylight. Bringing natural light indoors increases the comfort and well-being of occupants while reducing the need for energy-consuming artificial light. Drawing on the DAYSIM model, umi calculates annual daylight availability for each story in each building. Analysis of the Boston neighborhood—led by graduate student Timur Dogan—showed that about half the floor area inside the buildings receives some daylight, with about 15% of the total area receiving enough light to require no supplementary artificial lighting.
Outdoor comfort. The daylighting model also generates insights into how people will fare outdoors by examining conditions between the buildings. To assess outdoor comfort, umi combines hourly outdoor air temperature and solar radiation and then deems an outdoor space “hot” if the ambient temperature is above 28°C and there is direct incoming solar radiation and “cold” if the temperature is below 5°C and no direct radiation is incident. The figures below show results from the Boston case study, with the left-hand diagram showing hot spots in summer and the right-hand diagram showing cold spots in winter.
Outdoor comfort in the Boston neighborhood
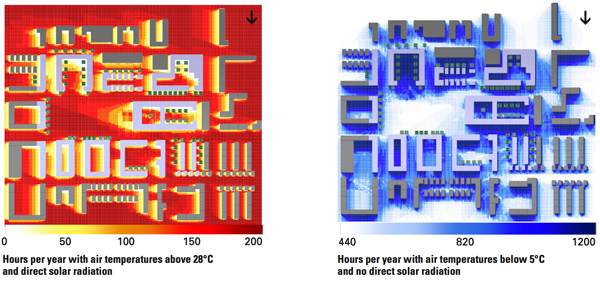
These diagrams show results of analyses with umi’s outdoor comfort module. The left-hand diagram shows hot spots in summer, defined as areas with ambient temperatures above 28oC and exposure to direct solar radiation. The right-hand diagram shows cold spots in winter, which are regions with temperatures below 5oC and no direct radiation. While umi’s comfort model is relatively crude and ignores factors such as local wind effects, it does provide guidance on where local shading or changes in building layouts might help.
Student demonstrations
For a good demonstration of umi’s full capabilities, Reinhart turned to student projects from his spring 2013 MIT class, Modeling Urban Energy Flows. More than two dozen MIT and Harvard graduate students in architecture, urban planning, and building technology enrolled in Reinhart’s class and simultaneously enrolled in a studio class taught by Miho Mazereeuw, assistant professor of architecture at MIT. In Mazereeuw’s class, they designed a solution for a real architecture problem somewhere in the world. In Reinhart’s class, they analyzed their proposed design using umi plus a small financial model that looks at cash flows.
One interesting analysis focused on Hunter’s Point, San Francisco, California, a region where redevelopment is now in progress. Using umi, the students analyzed the commercial development now being implemented as well as their own design for the same project, which is shown below in a diagram prepared by graduate students Christopher Mackey and Fei Hong of architecture. They added one factor to both analyses: resiliency to heat waves in 2080. In their design, they included outdoor spaces such as plazas, boulevards, and alleys that would reduce heat island effects, serve as “cool islands,” and permit access and penetration of daytime light. In addition, they oriented parks to capture the prevailing winds; they spread out commercial amenities to make them readily accessible to more residents; they adjusted the floor heights of buildings for optimal daylight; and they added natural ventilation and night cooling to reduce energy use. They then developed a “Score Card” presenting the quantitative results for each of the factors analyzed by umi (shown at the right in the figure). Compared to the developer’s proposal, their design more than doubled population density, almost halved energy use, significantly increased both daylit area and accessibility, and slightly reduced comfort—all with essentially no change in the financial burden.
Designing for resilience to future heat waves
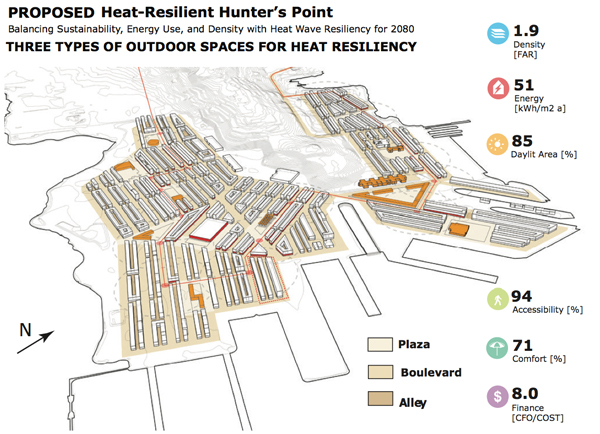
In an MIT class project, graduate students prepared this design for Hunter’s Point, San Francisco, California, a region now being developed by a commercial firm. Their goal was to maximize sustainability in light of possible heat waves in 2080. Among the features in the students’ sustainable design are plazas, boulevards, and alleys that will reduce the heat island effect and permit access and penetration of daylight. The orange color indicates public buildings such as libraries, museums, and schools that serve as anchor points/bus stops for the sustainable transportation network. In many cases, squares around the buildings collect runoff from surrounding neighborhoods and process it through artificial wetlands that serve as public parks. Using umi to analyze their overall design, the students generated values for the various metrics shown at the right—most of which are substantially better than those they calculated for the development now being built.
To Reinhart, the student projects confirm both the accessibility and the effectiveness of the umi platform. Their quality and findings demonstrate that the current version of umi can be learned and successfully applied by early career design professionals in a way that will lead to environmentally superior neighborhoods.
Ongoing work, continuing challenges
Reinhart and his colleagues have released the first public version of umi (available at urbanmodeling.net), and they are now working with the City of Vancouver, Canada, and the government of Kuwait to apply umi to selected neighborhoods. Meanwhile, they are continuing to expand and improve umi’s capabilities. One goal is to incorporate “embodied” energy and emissions, that is, the energy and emissions associated with the construction process and the materials used. Graduate student Carlos Cerzo is developing a module that will account for embodied energy and emissions and will calculate any savings that will result from initial energy-efficient investments as the building operates over time. Other, more fundamental research focuses on understanding microclimates that can occur around grouped buildings—for example, due to generated exhaust heat or redirected local wind patterns—and can profoundly affect the operation of individual buildings and the well-being of people outdoors. Leslie K. Norford, professor of architecture, is now completing an “urban weather generator” that will be incorporated into umi, providing invaluable inputs into all of the simulation modules.
According to Reinhart, the biggest challenge for the group right now is getting energy consumption data from cities to use in validating umi. “In the US, you can get lots of information about the buildings in a city but not on how much energy is used in them because that’s considered personal information,” he says. They know their simulation models work for individual buildings. But the step of going from individual buildings to the urban scale requires estimating certain inputs, and that process necessarily produces errors. “We can make good educated guesses, but the real test will be when we can get into neighborhoods and compare the actual data with our calculations,” says Reinhart. “We need to get energy use data for a few hundred buildings. It’s an ongoing process. But I’m sure we’ll get there.”
Reinhart notes that urban sustainability is a “big buzzword right now,” and lots of work is going on in the area. But there tends to be a shortage of hard data. “We try to come up with the best objective measures we can,” he says. “We don’t claim that you should look only at the objective metrics because then everybody will say that the city has to be livable, desirable—and I completely agree. But I think our work provides a meaningful way to look at how well a city does on certain levels, and that analysis should be part of the decision-making process as the world’s urban areas expand.”
Development of umi was supported by the MIT Energy Initiative (MITEI) and by the National Science Foundation (NSF), the US Department of Energy, United Technologies Corporation (a Sustaining Member of MITEI), and Transsolar Climate Engineering. Support for the Cambridge solar map came from the city’s Information Technology Department and from NSF. A first public version of umi was released in May 2013 during the Symposium on Sustainable Urban Design at MIT. The symposium was supported by MITEI, the MIT Center for Advanced Urbanism, and the German American Chamber of Commerce Inc. The symposium also hosted the signing ceremony of the Community Compact for a Sustainable Future. Further information can be found in:
J.A. Jakubiec and C.F. Reinhart. “A method for predicting city-wide electricity gains from photovoltaic panels based on LiDAR and GIS data combined with hourly DAYSIM simulations.” Solar Energy, vol. 93, pp. 127–143, 2013.
C.F. Reinhart, T. Dogan, J.A. Jakubiec, T. Rakha, and A. Sang. umi—An Urban Simulation Environment for Building Energy Use, Daylighting and Walkability. Building Simulation 2013 Conference, International Building Performance Simulation Association, Chambery, France, August 26–28, 2013.
This article appears in the Autumn 2013 issue of Energy Futures.
Press inquiries: miteimedia@mit.edu